
Key Takeaways
- Liquidity sweeps are strategic maneuvers by institutional players designed to trigger retail stop-losses and generate the necessary volume to fill large positions.
- The Giniloh simulator provides a frictionless environment that removes the emotional and cognitive barriers of real-world trading, allowing for risk-free experimentation with complex market scenarios.
- Traders can distinguish a liquidity sweep from a genuine breakout by identifying rapid price rejections and a lack of follow-through compared to sustained volume and consolidation.
- By using a visual, node-based interface, users can reduce cognitive load and focus on building a robust financial architecture rather than reacting to market noise.
- Simulating market volatility helps traders transition from emotional ‘gut feelings’ to executing logic-driven plans by anticipating where institutional ‘smart money’ will hunt for liquidity.
Introduction: My Journey Through Market Chaos
I’ve spent some time reviewing charts, wondering what it would actually feel like to see a liquidity sweep happen in real-time. Most of us only ever see the aftermath—that annoying, giant red candle that wiped out our position right before the price took off exactly where we predicted. It often feels like the market is personally mocking me, and I know I’m not alone in that frustration.
That’s one reason why we built the Giniloh Frictionless Money Flow Simulator. I think of it as a sandbox for your bank account where you can get your hands dirty and break things without touching your actual savings. It’s about pure, unfiltered learning in a space that mimics market chaos without the “oh no, there goes my rent money” consequences.
Think of it like a flight simulator for pilots, but for your wallet. I wouldn’t jump into the cockpit of a Boeing 747 without hundreds of hours of practice, so why do we treat our financial lives like a “learn as you go” experiment with real stakes? The simulator lets you crash the plane as many times as you need until you finally figure out how to land it in a storm.
We built this because the learning curve in finance is usually paved with really expensive mistakes. We wanted to shorten that curve significantly. By the time you move from the simulator to the real world, you aren’t just guessing anymore; you’re executing a plan that you’ve already seen work a dozen times in the sandbox environment.
Understanding the Liquidity Sweep
Let’s talk about the elephant in the room: the liquidity sweep. If you’ve spent more than five minutes looking at trading X or YouTube, you’ve definitely heard the term. But what does it actually look like when it’s happening to you?
In the trading world, a liquidity sweep is when the price of an asset spikes through a very obvious support or resistance level. The goal of this move isn’t just to move the price from point A to point B for the sake of it. It’s specifically designed to trigger a massive cluster of stop-losses and pending orders sitting just beyond those levels .
It’s like a giant magnet pulling in all the “weak” orders. Once those orders are triggered, the price quickly reverses direction, leaving everyone who was “stopped out” wondering what just happened. It’s essentially “smart money”—the big institutional players like hedge funds and massive banks—hunting for the liquidity they need.
These big players have so much money that they can’t just buy or sell whenever they want without moving the market against themselves. They need a big pool of orders to “fill” their own massive positions without causing a price spike they can’t control. This move catches the vast majority of retail traders completely off guard, leading to frustration and “revenge trading” .
The Mechanics of Frictionless Money Flow

In the context of the Giniloh simulator, the term “frictionless” carries a very specific and important meaning for us. We aren’t just talking about low fees or fast execution times, though those are nice perks. We are talking about the systematic removal of the cognitive, emotional, and structural barriers that make personal finance so hard.
The goal is to provide a space where you can experiment freely. You can test out “what-if” scenarios like, “What if I put 50% of my paycheck into this high-risk asset?” or “What if the market drops 20% tomorrow?” You can build your confidence without that paralyzing fear of losing money that usually clouds your judgment.
By removing the friction of real-world risk, you can focus entirely on the mechanics. You start to see the logic of your own strategies. You realize that your “gut feeling” is often just a reaction to market noise, and the simulator helps you tune that noise out so you can focus on the actual flow of money.
Identifying and Eliminating Financial Friction
Friction in the real world looks like three-day waiting periods for bank transfers. It looks like confusing apps that make you second-guess where you clicked. It looks like the panic you feel when a number on a screen turns red. In the simulator, all of that is gone.

When you reduce cognitive load, you free up your brain to think about the big stuff. Instead of worrying about whether you have $20 for lunch, you’re thinking about how to allocate $20,000 for a long-term goal. It’s a massive shift in perspective that only happens when you stop sweating the small stuff.
What Exactly Is a Liquidity Sweep?
If you have ever felt like the market was personally out to get you, you have probably experienced a liquidity sweep. It’s that moment where the price of a stock or a crypto asset whips past a recent high or a recent low. It looks like a breakout is happening, so you jump in, or perhaps you have a stop-loss sitting right there.
The price grabs all those stop-losses, effectively “sweeping” the liquidity from the market, and then it immediately snaps back in the opposite direction. It is a highly strategic move used by large-scale participants to generate the volume they need to enter or exit a trade .
Think of it like a poker game where one player has a massive stack of chips. They might make a big bet just to see who folds and who is bluffing. In the market, the “smart money” is testing the levels. They want to see where the orders are hidden so they can use them to their advantage.
Analyzing the Market Reaction
The real secret to understanding these moves isn’t just seeing the sweep itself; it is watching the reaction that follows. Whether the price holds above the level it just broke or reverses instantly tells you almost everything you need to know about what the market is likely to do next .
If the price sweeps a level and then stays there, it might be a genuine trend change showing strength. But if it sweeps and snaps back like a rubber band, you are looking at a classic liquidity grab. With the Giniloh tool, you don’t have to wonder anymore; you can simulate these exact scenarios yourself.
Mastering the Simulation Environment
So you want to simulate a liquidity sweep without accidentally nuking your actual bank account? That is a remarkably smart move. The financial world is a chaotic mess, and trying to test complex cash flow strategies in a live environment is a recipe for a very stressful phone call with your bank.
The Giniloh simulator lets you test wild ideas and watch them crash in a spectacular (but totally safe) digital explosion. We are moving away from the era of “checking your balance and hoping for the best” and into the era of automated, logic-driven systems. This tool is the bridge that gets you there.
In the real world, a single mistake with a transfer can lead to weeks of paperwork or lost interest. Here, a mistake is just a learning moment. You can reset the simulation as many times as you need until you find that “sweet spot” where your money is always in the right place at the right time.
The “Stop Hunt” and Institutional Behavior
A liquidity sweep happens when the price makes a sudden, sharp move into an area where a ton of orders are hiding. Think about where you usually put your stop losses or breakout entries. Those are the honey pots that the big players are looking for.
Institutional traders trigger these specific zones to grab the liquidity they need to fill their own massive positions. They need a “counterparty”—someone to take the other side of the trade . Once they’ve gathered enough orders, the market often reverses right back in the original direction.
This leaves retail traders scratching their heads and wondering why their “perfect” trade got stopped out right before it took off. It feels like a glitch in the matrix, but it’s actually just the mechanics of how large-scale orders get filled. You can model and even weaponize this knowledge using our simulator.
Building Your Financial Architecture
Setting this up isn’t about being a math genius; it’s about being a good architect. You are building a system that can survive a liquidity sweep by ensuring your capital is always where it needs to be before the volatility hits. You’re building the “pipes” for your money.
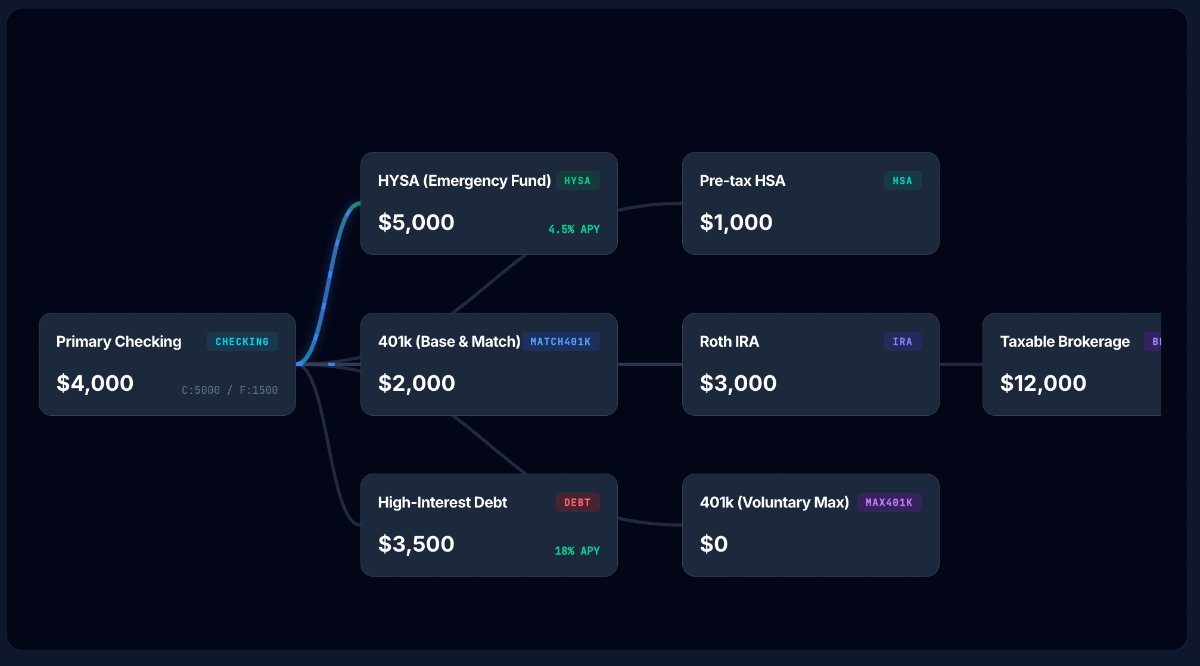
You start your journey on the Middle Canvas. In a separate article, I will explain you in detail how to implement these real use cases in the canvas for both, personal money flows and enterprise money flows. The Middle Canvas is the heart and soul of the simulator. If you’ve ever used a mind-mapping tool or a digital whiteboard, you’ll feel right at home here. It tracks every single penny across every virtual node with perfect precision.
Conclusion: Turning Theory into Practice
I’ve spent way too many hours staring at flickering candles to count. If there is one thing I’ve learned from years of hitting the “buy” and “sell” buttons, it’s that reading about a liquidity sweep in a textbook is a world away from actually seeing it eat your stop-loss in real time. It’s a completely different beast when your own pride is on the line.
That is exactly why this simulator is such a massive shift in how you learn. It isn’t just some basic sandbox; it’s a high-stakes lab for testing how the market actually moves when the big players start throwing their weight around. You aren’t just looking at history; you’re living it without the financial trauma.
Most traders spend years trying to develop a “gut feeling” for the market, usually with real money. That means every single “lesson” they learn comes with a painful price tag. The simulator flips that whole process on its head, allowing you to cram the experience of a thousand trades into a single afternoon.
Final Thoughts on Market Liquidity
You probably found your way here because you were curious about a liquidity sweep. Maybe you’ve been getting stopped out of trades that eventually go in your direction. It feels personal, doesn’t it? Like there’s a guy in a suit somewhere just waiting for you to enter.
Here is the big takeaway: sweeps aren’t just random chaos designed to make you miserable. They are calculated, necessary moves by big institutions who have a problem you don’t have: too much money. They are constantly hunting for “resting orders” to facilitate their own trades.
Using Giniloh, you can simulate how the price spikes through those clusters, vacuums up the liquidity assets, and then immediately reverses. You start to train your brain to look for the “pools” where retail traders have stacked their orders. Once you see the pool, you can anticipate the institutional sweep that clears them out.
FAQ
What is the primary purpose of the Giniloh Money Flow Simulator?
The simulator provides a risk-free sandbox to model market scenarios, such as liquidity sweeps, allowing users to practice financial strategies without risking real capital. It is designed to bridge the gap between theoretical market knowledge and practical execution.
How does a liquidity sweep differ from a genuine market breakout?
A liquidity sweep is characterized by a rapid price rejection and reversal after hitting a key level, whereas a genuine breakout involves the price holding and consolidating beyond that level. Sweeps are typically strategic moves used by institutional players to trigger stop-losses and generate volume.
What does the term frictionless mean within the Giniloh environment?
Frictionless refers to the removal of emotional biases, cognitive overload, and structural delays like bank transfer wait times. This allows users to focus entirely on the logic and mechanics of money flow without the stress of real-world financial consequences.
Why do institutional traders target retail stop-losses during a sweep?
Large institutional players require significant liquidity to fill massive positions without moving the market unfavorably. By triggering clusters of retail stop-losses, they create a pool of counterparty orders that facilitates their own large-scale entries or exits.
Can the simulator help in identifying stop hunts in real-time trading?
Yes, by practicing in the simulator, users learn to identify the liquidity pools where retail orders are likely clustered. This training helps traders anticipate institutional behavior and recognize the signs of a stop hunt before it impacts their actual capital.
What is the Middle Canvas mentioned in the article?
The Middle Canvas is the central interface of the simulator where users build their financial architecture. It uses a visual, node-based system to track every asset and movement with precision, making complex cash flows easier to visualize and manage.
How does the simulator address the emotional aspect of trading?
It eliminates the paralyzing fear of loss by providing a space where mistakes result in learning moments rather than financial trauma. This allows users to test high-risk scenarios and build confidence in their automated rules and strategies.
Is the Giniloh simulator intended only for professional traders?
No, it is designed for anyone looking to shorten the financial learning curve, from retail traders to individuals managing personal cash flow. It simplifies complex market phenomena into interactive lessons that are accessible regardless of a user’s technical background.
References
[1] Hustle to the top through jobs, deliveries, street races, gambling, and risky crypto plays.
[2] Interact with physically simulated piles of cash! Use various tools to clean money bills, coins, and.
[3] Everything’s under your control prices, customer flow, and occasionally.
[4] Timeflow is a game that helps you understand life and money better.
[5] This is a signal that price is likely to rise as smart money collects liquidity before pushing highe.
[6] # Liquidity Sweep Strategy (RR 1:2) This free indicator from its strategic department has a 60% pr.
[7] Example: Retail sees resistance at 1.
[8] [Liquidity Thermal Map \[JOAT\]](https://in.
[9] Use these to anticipate where price is likely headed to grab liquidity.
[10] BUY liquidity pools (from pivot lows, shown in teal) Each pool is zoned around the pooled level, mer.